How the Middle East Crisis Is Driving Oil and Gas Prices Through the Roof in 2026
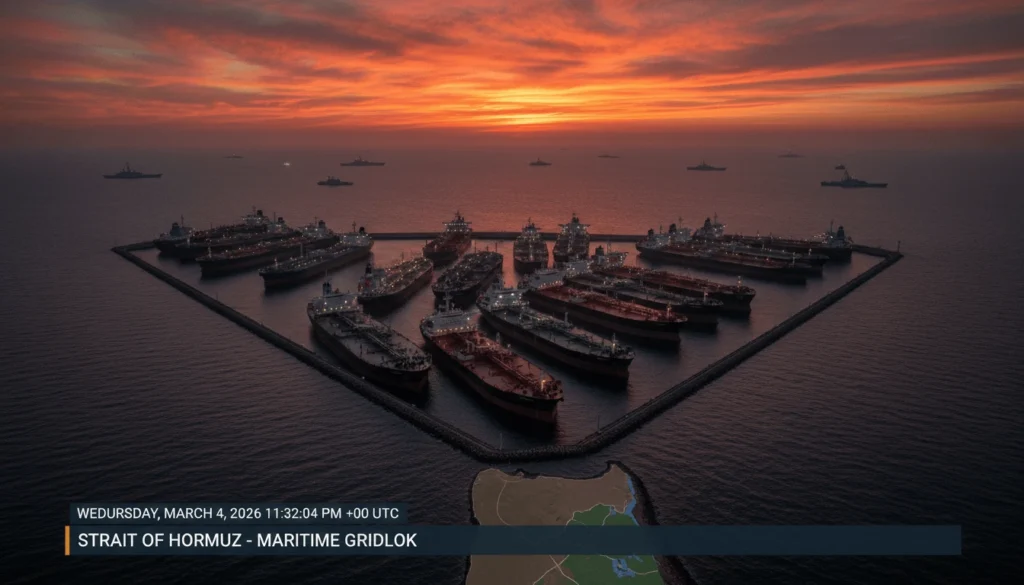
If you’ve been to the gas station in the last 72 hours, you’ve already felt it. Prices are up. Noticeably. And the reason is a single body of water: the Strait of Hormuz, a 21-mile-wide chokepoint between Iran and Oman that holds the global energy system hostage every time the Middle East catches fire. Right now, it’s on fire.
This is the most serious disruption to global oil and gas markets since the 1973 Arab oil embargo. What’s happening in the Middle East is no longer a geopolitical risk premium on a Bloomberg terminal, it’s a real, live supply shock that is rippling from Persian Gulf shipping lanes all the way to your heating bill, your gas pump, and eventually the price of everything transported by truck.
Here’s what’s happening, why it matters, and what the realistic scenarios look like going forward.
What Triggered the Current Crisis?
On February 28, 2026, the United States and Israel launched coordinated airstrikes on Iran under what has been called Operation Epic Fury, targeting military facilities, nuclear sites, and senior leadership, including the death of Iran’s supreme leader Ali Khamenei. Iran responded immediately with missile and drone barrages on Israeli cities and U.S. military bases across Gulf states including the UAE, Qatar, and Bahrain. Within hours of the strikes, Iran’s Islamic Revolutionary Guard Corps transmitted warnings via international maritime radio that no commercial vessels would be permitted to pass through the Strait of Hormuz.
Tanker traffic through the strait, which normally handles around 20 million barrels of oil per day, representing roughly 20% of global seaborne oil trade, dropped first by approximately 70% and then, effectively, to zero for commercial operators. Major container shipping companies including Maersk and Hapag-Lloyd suspended transits. War-risk insurance premiums for the strait surged from 0.125% to between 0.2% and 0.4% of ship insurance value per transit, an additional cost of a quarter of a million dollars for very large crude tankers. The result: a de facto closure of the world’s most critical energy chokepoint.
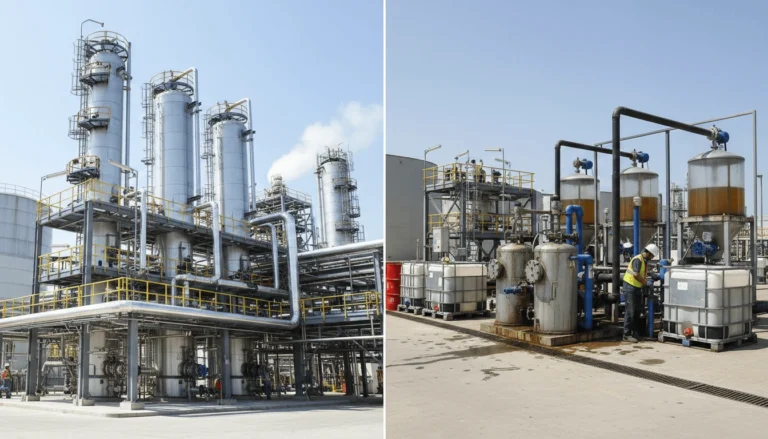
Qatar, which supplies 12% to 14% of Europe’s LNG through the strait, reported drone strikes on key natural gas facilities and temporarily shut down LNG production. Saudi Arabia shot down drones targeting an oil refinery. The Houthis in Yemen announced a resumption of attacks on Israeli and commercial shipping in the Red Sea, forcing Suez Canal traffic to reroute around Africa’s Cape of Good Hope, adding weeks to transit times and significantly higher freight costs.
The energy shock that experts had been theorizing about for years was suddenly, abruptly real.
What Has Happened to Oil Prices?
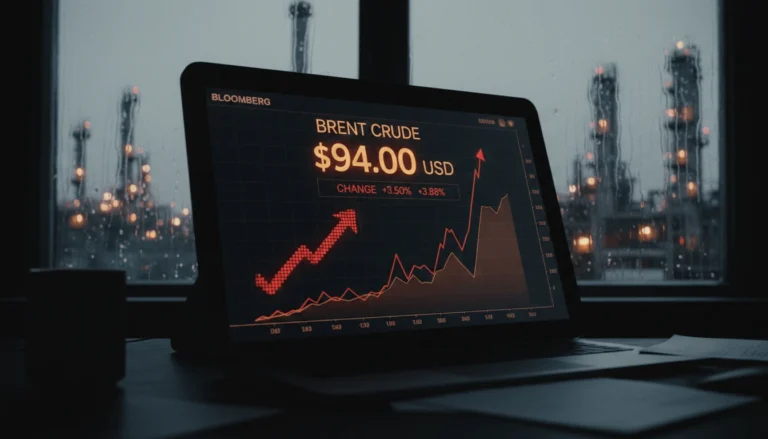
The market reaction was swift and severe. When oil trading opened on Sunday night after the weekend strikes, Brent crude briefly topped $80 a barrel before settling. By Monday, global crude prices surged past 9% in a single session, one of the sharpest single-day moves in years. West Texas Intermediate (WTI) hit $72 a barrel, up 8% from $67 on Friday. Brent crude reached $79 per barrel, up 8% from $72.87 the prior week.
By Tuesday, the picture had worsened. Brent crude jumped a further 8% overnight to reach $84 a barrel. WTI was trading just below $75 a barrel as of Wednesday. Goldman Sachs raised its Brent price forecast for Q2 2026 by $10, to $76 per barrel, based on an assumption of five more days of severely restricted exports through the Strait of Hormuz followed by a gradual recovery. But analysts warned that a five-week disruption from the strait could push Brent to $100 per barrel or beyond.
Bank of America went further, warning that a prolonged strait disruption could push Brent above $100 per barrel and European natural gas prices above €60 per megawatt hour. That second number matters enormously because European gas storage is currently depleted after a hard winter, making the continent acutely vulnerable to any LNG supply disruption.
Mizuho Bank noted an additional factor that isn’t visible in the headline oil price: higher war-risk insurance costs are adding between $5 and $15 per barrel to the effective price of getting oil from the Persian Gulf to its destination, meaning the “war premium” in crude is significantly larger than the spot price movement suggests.
What Has Happened to Gas Prices?
In the United States, analysts estimated that the spike in crude oil prices would push gasoline prices up by 10 to 30 cents per gallon on average in the immediate term, with some individual stations seeing prices rise as much as 85 cents. AAA data showed overnight surges of 8 cents per gallon in Philadelphia, 10 cents in New Jersey, and 13 cents in Delaware. The U.S. national average reached $3.10 per gallon, 11 cents higher than Monday, wiping out much of the price decline that had been forecast for 2026, when analysts had projected the national average would fall below $3.00 for the first time in years.
Heating oil prices have also spiked, with direct consequences for households in the northeastern United States and across Europe heading into late winter. Diesel costs, which directly affect the price of nearly everything transported by truck, are rising in parallel with crude, with cascading implications for food prices, consumer goods, and inflation broadly.
Natural Gas: The Often-Overlooked Half of the Story
European natural gas prices had been recovering from a brutal winter that left continental storage well below average seasonal levels. The closure of the Strait of Hormuz hit European LNG supply at precisely the worst moment. Europe’s benchmark Dutch TTF natural gas futures nearly doubled in 48 hours, surging from around €30 per megawatt hour to a peak above €60/MWh on Tuesday March 3, the kind of move that, sustained over weeks, would push energy bills to crisis levels across the continent.
Some relief came on Wednesday when a New York Times report indicated Iranian operatives had reached out to discuss terms for ending the conflict with the U.S. and Israel. Dutch TTF futures dropped back to around €48/MWh on the news, still dramatically elevated from the pre-crisis baseline, but off the peak.
The fundamental dynamic remains fragile. Europe imports nearly all of its oil and a significant share of its LNG, making it acutely exposed to a dual energy and trade shock. Qatar, a primary LNG supplier to Europe, reported drone strikes on its gas facilities and temporarily halted production. Even with U.S. LNG exports at record levels, the U.S. became the world’s largest LNG exporter after recent terminal investments, American export capacity cannot fully replace Gulf LNG volumes if the disruption becomes prolonged.
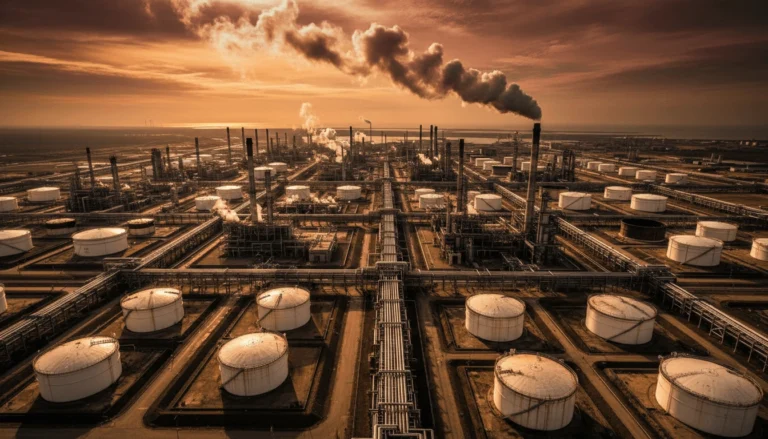
The Strait of Hormuz: Why One Waterway Controls Everything
To understand why this crisis has such outsized global impact, you need to understand the geography. The Strait of Hormuz is just 21 miles wide at its narrowest point. Through those 21 miles, every day under normal conditions, approximately 20 million barrels of crude oil and condensate pass, around 20% of the world’s entire daily oil consumption. In 2025, roughly a third of total global seaborne oil exports transited the strait. On top of oil, roughly 20% of global LNG exports flow through the strait, primarily from Qatar.
The countries whose oil depends on Hormuz transit include Saudi Arabia, the United Arab Emirates, Iraq, Kuwait, Qatar, Bahrain, and Iran itself. In 2024, an estimated 84% of crude oil and condensate shipments through the strait were destined for Asian markets, China, India, Japan, and South Korea are the most exposed economies. Europe gets 12% to 14% of its LNG from Qatar, routed through the strait.
There are partial alternatives. Saudi Arabia’s East-West Pipeline has a capacity of 7 million barrels per day, and the UAE has a pipeline to its Fujairah terminal on the Gulf of Oman. But both routes face throughput constraints, and neither can offset a full Hormuz closure at current capacity. The brutal arithmetic is this: there is no backup plan that fully replaces 20 million barrels per day of maritime transit.
How Are Global Markets Responding?
Beyond energy, the crisis is reverberating across global financial markets though the initial reaction was more contained than some feared. Equity markets sold off sharply at first but partially recovered as investors shifted to a wait-and-see mode. The Dow Jones Industrial Average fell as much as 600 points intraday on Monday before closing down just over 70 points. The S&P 500 ended essentially flat. This relatively restrained equity reaction reflects two realities: first, markets are well-supplied with oil in absolute terms thanks to high inventories (China in particular has significant floating and onshore storage). Second, traders are pricing in the possibility that the conflict resolves quickly, a scenario they have seen play out before in Middle Eastern crises.
Macroeconomic risks
The National Institute of Economic and Social Research (NIESR) modeled three scenarios. In a temporary price shock, the impact on inflation is around 0.3 percentage points, manageable. In a one-year persistent shock, UK inflation rises by 0.7 percentage points and GDP growth falls by 0.2%, with the Bank of England potentially forced to raise interest rates back above 4%. Former U.S. Treasury Secretary Janet Yellen warned that the conflict could fuel inflationary pressures in the United States, holding the Federal Reserve back from rate cuts that markets had been anticipating.
For Asia, Goldman Sachs estimated that a jump in oil prices from $70 to $85 per barrel, sustained over six weeks, could raise regional inflation by about 0.7 percentage points. Countries like the Philippines and Thailand are considered most vulnerable, while China, which has significant strategic reserves, faces a more modest near-term impact but is quietly pivoting its crude sourcing toward Russia to compensate for disrupted Gulf flows.
That Russian pivot is notable. The crisis is materially improving Russia’s competitive position in global crude oil markets. With Middle Eastern barrels facing logistical disruption, both India and China face strong incentives to deepen reliance on Russian supply, an outcome with significant long-term geopolitical implications.

What Are the Scenarios From Here?
Scenario 1: Short Disruption (1–2 Weeks), Most Likely in Short Term
If the conflict moves toward negotiation quickly, as Wednesday’s initial diplomatic signals suggested it might, the world is reasonably well-positioned to absorb the disruption. Global oil inventories are elevated. Strategic petroleum reserves exist specifically for situations like this. OPEC+ announced an increase in production of 206,000 barrels per day for April. Under this scenario, Brent likely peaks in the $80–$90 range and gradually retreats. Gasoline prices rise 15–30 cents and then start declining within weeks.
Scenario 2: Medium Disruption (3–6 Weeks), Serious but Manageable
Goldman Sachs’ base case assumption of five more days of severely restricted Hormuz exports, followed by a month-long gradual recovery, puts Q2 2026 Brent at around $76 per barrel. A five-week disruption could push Brent toward $100. Under this scenario, inflation is meaningfully impacted in Europe and Asia, central banks face difficult decisions on rate cuts, and jet fuel, diesel, and heating oil prices remain elevated well into summer.
Scenario 3: Prolonged Disruption or Infrastructure Damage (2+ Months), Severe
If critical export infrastructure, particularly Saudi Arabia’s Ras Tanura terminal or UAE’s Jebel Ali, sustains significant damage, the supply impact would be immediate and severe. Bank of America’s worst-case scenario puts Brent above $100 per barrel and European natural gas above €60/MWh for a sustained period. Under this scenario, global recession risk increases materially. Central banks have to choose between fighting energy-driven inflation and supporting growth, and the geopolitical realignment of global energy supply, with Russia and U.S. producers as primary beneficiaries, accelerates dramatically.
Who Wins and Who Loses?
Winners: U.S. oil and gas producers stand to benefit directly from higher crude prices. As a net energy exporter, the United States gains economically when global prices rise, a significant reversal from the oil-import era. Russia, as noted, benefits from Asian buyers pivoting away from disrupted Gulf supply. Norway, Canada, and other non-Middle Eastern producers also benefit.
Losers: European economies, already dealing with depleted gas storage and energy-sensitive industrial bases, face the sharpest near-term pain. Asian oil-importing nations, particularly the Philippines, Thailand, South Korea, and Japan, face meaningful inflation hits. Airlines, shipping companies, and any business with significant fuel costs will see margin compression that eventually passes through to consumers.
Ordinary people everywhere: Pay more at the pump, more for heating, and eventually more for everything transported by road or air.
Stay updated on oil and gas prices, market analysis, and energy news at fuelandoilcompany.com.