What to Expect at the Gas Pump From May to August
Nobody saw this coming, at least not this fast.
On January 1, 2026, GasBuddy forecast the national average gasoline price would peak at $3.12 per gallon in May. The EIA predicted a full-year average of $2.91 per gallon. Analysts were talking about gas below $3.00 for the first time since 2020. Drivers were finally getting relief.
Then the Strait of Hormuz closed.
As of today, March 23, 2026, AAA’s national average for regular gasoline stands at $3.84 per gallon, a staggering jump of more than 91 cents from just one month ago. Diesel has hit $5.07 per gallon. Those are not typos. In the span of 30 days, the entire 2026 fuel price outlook has been rewritten from the ground up. And summer driving season, the period from Memorial Day through Labor Day when Americans drive the most, is still weeks away.
This article tells you exactly what happened, what the updated forecasts say, and what you can realistically expect at the pump from May through August 2026. It also gives you the most practical, actionable strategies to manage your fuel costs through what is shaping up to be the most expensive summer driving season in recent memory.
1. Why Summer Always Pushes Gas Prices Higher
Before we get to the 2026 crisis numbers, it helps to understand why summer is always expensive for fuel, even in normal years. The seasonal pressure was already building before any geopolitical event changed the picture.
The Annual Summer Price Cycle
Every single year, without exception, gasoline prices rise in spring and peak somewhere between April and June. This is not a coincidence or a market quirk. It is a predictable, well-understood seasonal pattern driven by two simultaneous forces: rising demand and more expensive supply.
On the demand side, Americans simply drive more in summer. Schools close. Family road trips begin. Memorial Day, Fourth of July, and Labor Day weekends each generate massive spikes in fuel consumption. The EIA consistently forecasts higher Q2 and Q3 gasoline demand than Q1 or Q4. More drivers on the road means more competition for available fuel supply and prices respond accordingly.
On the supply side, something equally predictable happens every February and March. Refineries begin the annual switchover from winter-blend gasoline to summer-blend gasoline. The summer formula contains pricier additives designed to reduce evaporation during warmer months and comply with federal clean air regulations. The national average jumped more than 5 cents in a single week in late February as refineries began producing summer-blend gasoline, which contains costlier additives to help reduce evaporation during warmer months. That switchover cost, typically 8 to 15 cents per gallon, is paid by consumers every spring.
The Summer Blend Switchover: Timing and Cost Impact
The summer blend switchover is not a single event. It is a rolling process that happens at different times in different regions. California and the Northeast switch earliest, often beginning in February, because their air quality regulations are the strictest. The rest of the country follows through March and April, with the June 1 deadline being the universal federal cutover date.
During the switchover period, refineries temporarily reduce output while they reconfigure their production processes. That brief supply reduction, combined with the higher cost of summer-blend components, creates a reliable price spike every single year. In normal years, this adds 10 to 20 cents per gallon compared to the winter baseline. It is the floor of the seasonal price increase that consumers experience every spring without fail.
The switchover also creates regional price disparities. States that require unique summer blend formulations, California being the most extreme example, can see prices spike dramatically if local refinery capacity is disrupted. California’s boutique fuel requirements mean it cannot easily import gasoline from neighboring states to compensate for supply shortfalls. That isolation is why California prices are structurally $1.00 to $1.50 per gallon higher than the national average and why they spike harder when anything goes wrong.
Spring Break and Memorial Day: The Demand Bookends
Two demand events define the spring fuel price cycle. Spring break, spread across March and April depending on school district, is the first significant road trip season of the year. Families load up the minivan. College students drive to the coast. Fuel demand surges regionally and nationally.
Memorial Day weekend is the bigger event. It is the unofficial start of summer and historically the highest-demand weekend of the entire year for gasoline. AAA typically reports 35 to 40 million Americans traveling over Memorial Day weekend, the vast majority by car. That concentrated demand spike on a single weekend pushes local and national average prices higher in the days leading up to it. Savvy drivers know that filling up on the Wednesday before Memorial Day is almost always smarter than filling up on Friday or Saturday.
GasBuddy’s monthly forecast projects the seasonal pattern will follow traditional dynamics: a rise from winter lows up to a peak of around $3.12 in May 2026 as refineries switch to costlier summer-blend gasoline and spring driving demand ramps up, followed by a gradual decline through the back half of the year to a projected December 2026 low of $2.83. Those were the pre-crisis numbers. They no longer apply.
2. The 2026 Crisis Layer: Geopolitics on Top of Seasonal Patterns
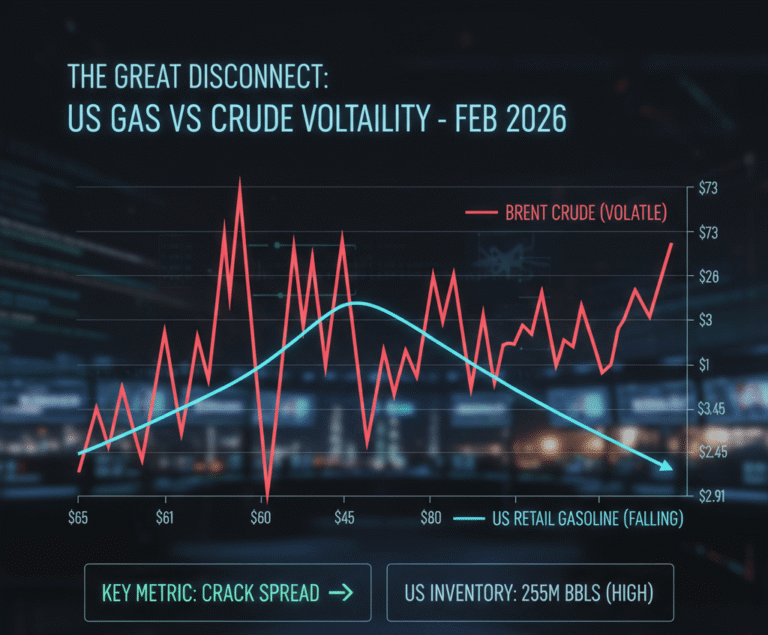
Here is where 2026 diverges completely from every prior year’s seasonal playbook. The Middle East crisis has not replaced the seasonal pressures. It has been added on top of them, amplifying every existing upward force simultaneously.
The Numbers That Rewrote the Forecast
AAA’s daily tracking shows regular gasoline at $3.790 as of March 18, up 5.2 cents from Tuesday’s average, 26.4 cents higher than a week ago when it stood at $3.578, and a staggering 91 cents higher than a month earlier when averages hovered around $2.923, the steepest monthly rise in recent memory.
Diesel tells an even more dramatic story. On-highway diesel climbed to $5.071 per gallon, a 21.2-cent weekly rise and a massive 96-cent surge from early March levels around $3.897. Year-over-year, diesel stands $1.522 higher than the same period in 2025, while gasoline is up roughly $1.20 from last year’s figures.
Those numbers represent a complete inversion of everything that was expected for 2026. The year was supposed to deliver the fourth consecutive annual price decline. GasBuddy had projected the 2026 national average at $2.97 per gallon, the lowest annual average since 2020, with prices softening after June and December averaging near $2.80 per gallon. Instead, March alone has erased those gains and pushed prices into territory that was not supposed to appear until peak summer under any pre-crisis scenario.
The Seasonal and Geopolitical Pressures Combined
The timing of the Strait of Hormuz disruption could not have been worse from a seasonal perspective. The crisis hit in the first week of March, exactly when the summer blend switchover was already underway and when seasonal demand was already building.
Refineries were already producing more expensive summer-blend gasoline. Inventories were already being drawn down for the spring transition. The geopolitical shock landed on a market that had zero spare flexibility to absorb additional supply disruption. The result was a price surge that combined the seasonal premium and the geopolitical premium into a single, devastating price spike.
The EIA projects annual average retail gasoline prices around $2.90 per gallon for 2026 overall, implying potential moderation later in the year as seasonal demand eases and supply adjustments occur. However, any further escalation in Middle East tensions could prolong the surge. That caveat is the critical variable for summer planning.
What the Updated EIA March STEO Says
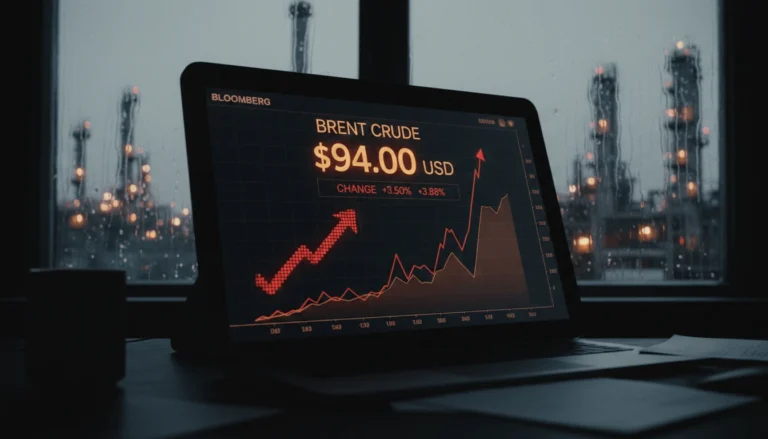
The EIA’s March 10 Short-Term Energy Outlook revised the entire price forecast upward. Brent crude is now expected to stay above $95 per barrel through April before falling below $80 in Q3. Those revised crude forecasts translate directly into higher fuel price projections for Q2, the heart of summer driving season.
The EIA’s original Q2 2026 gasoline forecast was $3.04 per gallon. That forecast was built on a $58 per barrel Brent assumption. With Brent now expected to average above $95 through April and above $80 through Q2, the gasoline price forecast for Q2 has been revised significantly higher. The difference between $58 Brent and $95 Brent translates to approximately 85 cents per gallon in crude cost pass-through. Even with a partial transmission to retail, summer gasoline above $4.00 is now a realistic scenario in many markets.
3. EIA Quarterly Forecasts: The Updated Q2 and Q3 2026 Projections
The forward price picture for summer 2026 has two very different scenarios. Everything depends on how quickly the Strait of Hormuz situation resolves and how fast the crude price normalizes.
The Optimistic Case: Q3 Relief Arrives
The EIA’s base case assumes the Strait of Hormuz crisis begins resolving in late April or early May. Under this scenario, Brent crude falls from $95 toward $80 per barrel through Q2 and below $80 in Q3. Gasoline prices peak in April or May and begin declining toward the original seasonal forecast trajectory in June and July.
Under the optimistic case, the summer driving season peaks at $4.00 to $4.20 per gallon nationally in May, painful, but temporary. By July 4 weekend, prices could be back in the $3.50 range as lower crude filters through. By Labor Day, the national average could approach $3.20 to $3.30, significantly higher than the original $2.97 annual forecast, but meaningfully below the crisis peak.
The EIA’s quarterly forecast projects Q3 2026 at $2.97 per gallon and Q4 at $2.76 per gallon, numbers from the pre-crisis February STEO that now represent the best-case scenario rather than the base case. Achieving those numbers requires crude to fall back toward $70 per barrel on the EIA’s revised timeline. Every week the Strait of Hormuz remains disrupted pushes that timeline further out.
The Pessimistic Case: High Prices All Summer
The pessimistic scenario assumes the Middle East conflict drags through May and June. Brent stays above $85 per barrel through the entire Q2 period. The summer blend switchover adds its normal seasonal premium on top of an already-elevated baseline. Memorial Day weekend demand hits a market that has not yet received meaningful supply relief.
Under this scenario, gasoline stays above $4.00 nationally through June. Diesel stays above $4.50. Peak prices in high-cost states like California, Hawaii, and the Northeast could exceed $5.50 per gallon. The average American household, which GasBuddy projected would spend $2,083 on gasoline in 2026, could instead spend $2,800 or more, approaching the $2,945 the EIA estimated households spent in the crisis year of 2022.
Regional Differences: Where You Live Determines Your Pain
The national average is a useful headline number. But the regional disparity in 2026 is as wide as it has ever been. The gap between the Gulf Coast at $2.476 per gallon and the West Coast at $3.938 per gallon is an enormous $1.46 difference for the same grade of fuel. That regional gap was calculated before the crisis. Today, both figures are significantly higher — but the West Coast premium has widened further.
The 10 states most insulated from the price spike are those clustered around the Gulf Coast — Texas, Louisiana, Oklahoma, Alabama, Mississippi, Arkansas, Tennessee, Missouri, South Carolina, and Kansas. These states benefit from proximity to the largest concentration of U.S. refining capacity, lower state fuel taxes, and pipeline access to domestically produced crude that is less affected by Persian Gulf disruptions.
The states most exposed are those farthest from domestic refining capacity — California, Hawaii, Alaska, Washington, Oregon, and the Northeast corridor. These markets are more dependent on imported refined products, carry higher state fuel taxes, and have boutique fuel requirements that limit their ability to source supply from alternative regions.
4. How the Middle East Crisis Changes Every Summer Planning Assumption
For anyone planning summer travel, fleet management, or business fuel budgeting, the 2026 crisis has invalidated every assumption made before March 1.
For Families Planning Road Trips
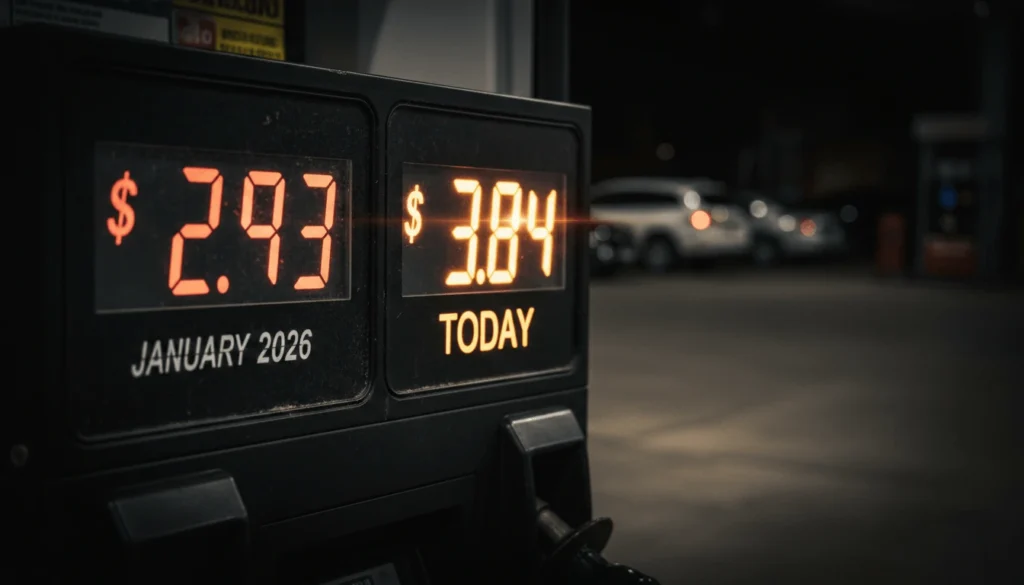
The family road trip is the defining activity of the American summer. And in 2026, it just got dramatically more expensive. A family driving a typical SUV averaging 24 miles per gallon on a 2,000-mile round-trip road trip will consume approximately 83 gallons of gasoline. At January’s $2.81 per gallon, that trip cost $233 in fuel. At today’s $3.84 per gallon, the same trip costs $319. If prices hit $4.20 at the summer peak, the trip costs $349.
That $116 increase per trip, compared to January expectations, is not trivial for middle-income households. Road trip planning budgets built in January need to be revised upward by 30% to 50% to account for the current price reality. The silver lining: if the EIA’s Q3 relief scenario plays out, anyone planning a July or August trip rather than a May or June trip may see meaningfully lower prices by departure date.
For Fleet Operators and Small Businesses
The diesel price shock is more severe and more immediately consequential for businesses than the gasoline spike. Diesel at $5.07 per gallon, up 96 cents in a month, directly and immediately raises operating costs for every trucking company, delivery service, construction firm, and agricultural operation in the country. A truck consuming 150 gallons per week now costs $764 to fill versus $619 a month ago, a $145 per week increase per vehicle. A fleet of 20 trucks absorbs an extra $2,900 per week in fuel costs, $150,000 per year if sustained.
Fleet operators need to act immediately. Review fuel hedging arrangements. Negotiate fuel surcharge clauses with customers if contracts allow. Evaluate routing efficiency to reduce miles driven. Consider consolidating deliveries. Every operational lever that reduces fuel consumption delivers outsized returns in a $5.00 diesel environment.
For Airlines and Air Travel Passengers
Jet fuel has absorbed the sharpest crack spread surge of any fuel in 2026. Jet fuel at $5.00 per gallon or above directly compresses airline operating margins. Airlines that booked summer inventory months ago at pre-crisis fuel assumptions are repricing that inventory now. Expect summer 2026 airfares, particularly for July and August bookings, to carry implicit fuel surcharges even if they are not explicitly labeled as such.
Booking summer flights now, before airlines fully reprice for the higher fuel environment, is almost certainly smarter than waiting. Every week the crisis continues gives revenue management teams at the major carriers more data and more pricing power to push summer fares higher. The window for pre-crisis-era summer airfare pricing is narrowing rapidly.

5. Smart Strategies to Cut Your Fuel Costs This Summer
The crisis is real. The prices are high. But you are not powerless. Here are the most effective strategies to reduce your fuel spending from May through August.
Time Your Fill-Ups Strategically
Fuel prices are not uniform across the week. GasBuddy’s analysis consistently shows that Monday and Tuesday are the cheapest days to buy gasoline in most markets. Prices typically rise Wednesday through Friday as weekend demand builds. Saturday and Sunday are the most expensive days to fill up. Shifting your fill-up habit from Friday afternoon to Monday morning can save 5 to 10 cents per gallon, small per transaction but meaningful over a summer of fill-ups.
Time of day also matters. Fuel is denser and contains more energy per gallon when it is cold. Buying fuel in the early morning, before the ambient temperature rises, means you get slightly more energy per dollar spent. The difference is small but real.
Use GasBuddy, AAA’s fuel price finder, or Google Maps to identify the cheapest stations within a reasonable distance of your regular routes. In high-price markets, the spread between the most and least expensive stations in the same neighborhood can be 30 to 50 cents per gallon. Five minutes of price checking before a fill-up pays for itself instantly.
Improve Your Vehicle’s Fuel Efficiency
In a $3.84 gasoline environment, every mile per gallon improvement in your vehicle’s efficiency translates directly into real money saved. The most impactful actions are the simplest ones. Keep your tires inflated to the manufacturer’s recommended pressure, underinflated tires increase rolling resistance and reduce fuel economy by 0.5% per pound of pressure drop. Remove unnecessary weight from your vehicle, an extra 100 pounds reduces fuel economy by approximately 1%.
Adjust your driving style. Aggressive acceleration and hard braking consume dramatically more fuel than smooth, anticipatory driving. Maintaining a steady highway speed between 55 and 65 miles per hour, rather than 75 or 80, improves highway fuel economy by 10% to 15%. Use cruise control on highways. Park in the shade when possible to reduce air conditioning load. These habits compound quickly over a summer of driving.
Plan Summer Road Trips Around the Price Calendar
If the EIA’s optimistic scenario plays out, gasoline prices peak in April or May and begin declining through June and July. That timing creates a strategic opportunity. Road trips planned for July or August, rather than Memorial Day or June, are likely to be cheaper on fuel if the crisis resolves on the EIA’s assumed timeline.
Build flexibility into your summer travel plans if possible. A road trip shifted from Memorial Day weekend to the Fourth of July weekend could save 30 to 50 cents per gallon if crude prices moderate as the EIA forecasts. A shift from June to August could save even more. The uncertainty is real, the crisis could persist, but the directional bet favors later-summer travel over earlier-summer travel based on current forecasts.
The Bottom Line: A Summer of High Prices, With Relief Possible in the Second Half
Summer 2026 is going to be expensive. There is no way to sugarcoat that. Gasoline at $3.84 today, still weeks before the seasonal peak, with diesel at $5.07, means the summer driving season is starting from a higher baseline than any year since 2022. If the Strait of Hormuz crisis persists through May, the national gasoline average could exceed $4.00 and potentially approach $4.50 in high-cost states.
The relief scenario, lower crude prices in Q3 and Q4 as the crisis resolves, is real and data-supported. The EIA’s updated March STEO models a meaningful price decline in the second half of the year. But that scenario depends on geopolitical developments that no forecast model can guarantee.
What you can control: when you buy fuel, how much fuel your vehicle consumes, when you plan your trips, and how aggressively you use the tools available to find the cheapest prices in your area. In a $4.00 gasoline environment, those decisions add up to hundreds of dollars in savings over a summer.
Track daily fuel prices and get the latest oil market analysis at www.fueloilcompany.com.